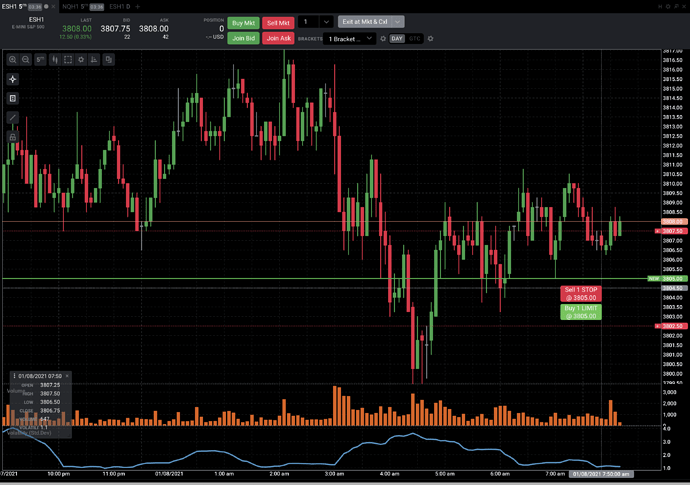
the wick of the candle looks too thin
When moving the graphics they move slowly, I have high speed internet and everything moves slow, when entering an operation it takes a couple of seconds to execute
The wicks of the candles are hardly visible in the graphs, a very thin line is shown and that in the configuration I have the candle wick in white
It looks like you are using the Chart (beta) module. Can you add the legacy “Chart” module to your workspace and see if you see the same issue?
What he is talking about is what i was referring to in my post as “Line Quality” if the Beta chart not equal to the Legacy Chart.
Again, not to beat a dead horse here, Brian, but I totally agree with MadCat and Manuel. The line quality is a real issue as is the overall look and feel of the new beta charts. I know it’s built from the ground up but for those of us who don’t use TPO, the beta so far has been very frustrating. I spend most of my time in regards to the beta charts wondering: how am I going to be able to get back to where things were with legacy charts so I can actually work and trade in the way I’m used to if I’m forced over to the beta at some point. I know change in inevitable but having gone through this type of thing with ToS many years ago, I worry that trying to change too much too fast can be counter-productive and just frustrate your user base. I just truly hope you will consider offering the legacy charts for a long time to come if the beta charts are unable to match the look and functionality of the charts that has made Tradovate such a fantastic platform. Just my 2 cents…
Hi @MadCat
We made some adjustments to the Charts (beta) and pushed an update to the “beta” version of our platform with these changes over the weekend. These should address some of the issues you were seeing with the custom indicators as well as with the general look and feel of the plots.
Be sure to look for Ver 1.201223.0
The legacy charts contain the limit and stop orders before placing an order. The new charts do not.
Can this be added? This is helpful to determine profit/loss targets.
Hey,
beta charts have some bugs that need to be fixed see the image I have attached!
QUESTION:
COULD YOU ADD THE P&L in ticks, points and Currency ( a choice made by trader) in the price entry line? I mean the P&L and the lot size both
You should add the number of active lots near the X cancel button (in the chart)
This addition could avoid confusion sometimes when we are in fast market
Also the P&L on open position (somewhere in the line) could be fine
where is the link to download the desktop version of this (latest) release?
8 posts were split to a new topic: Show PNL on Position Line on Chart
Opening with a stop cannot be moved on the beta charts, need to keep the legacy chart open to be able to adjust, the bracketed stop can be moved however which is weird, also note those labels that get stuck on the chart, they are very annoying as they obscure wicks some times
More info after talking to support: Only happens on beta charts when you don’t have any positions open and use a stop to open a position, with a bracket order, for example: a stop buy above the current price, doesn’t happen if you are using limit orders to buy below the current price.
Works on the legacy charts no matter how you do it.


