Alexander,
first off, thank you so much for providing this tool its really helpful.
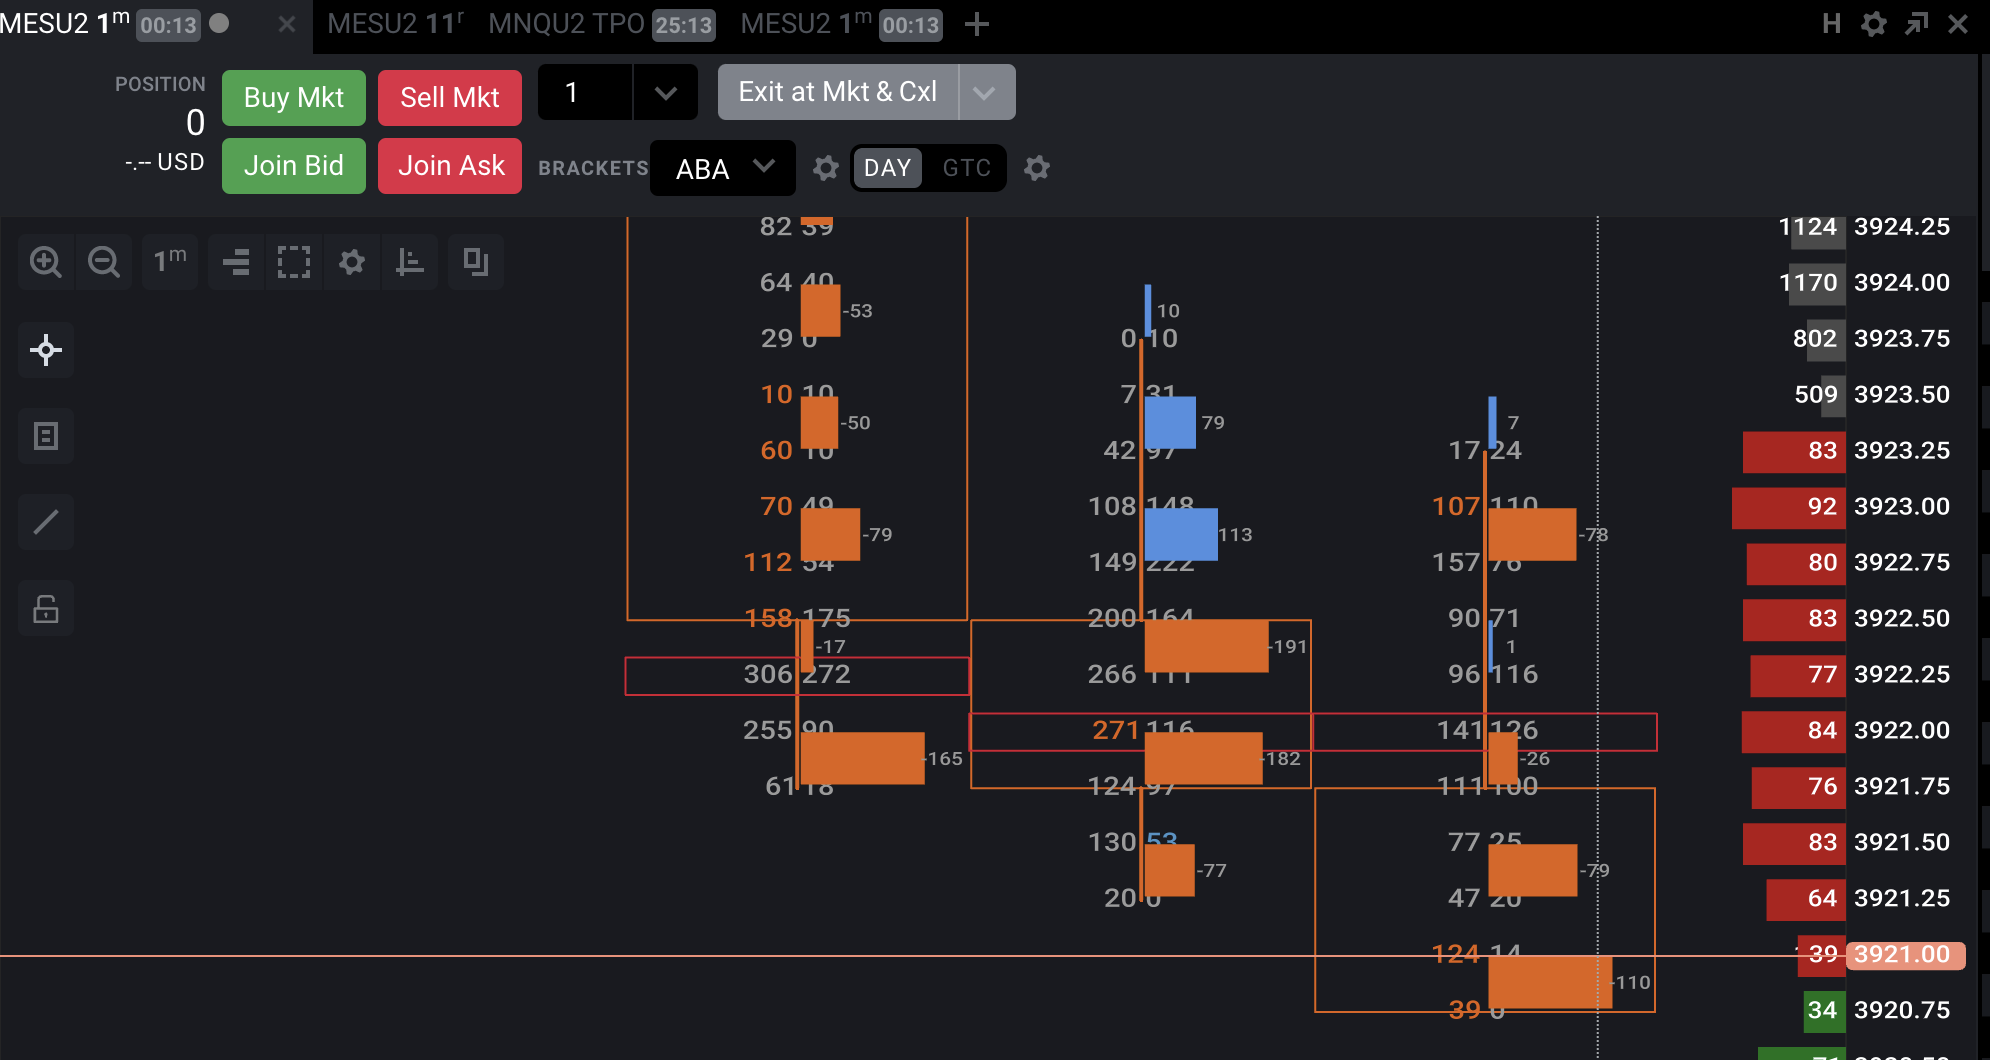
Although I was wondering why the bars per price level don’t match the numbers on the bid-ask chart.
looking forward to your reply!
thanks
Alexander,
first off, thank you so much for providing this tool its really helpful.
Although I was wondering why the bars per price level don’t match the numbers on the bid-ask chart.
looking forward to your reply!
thanks
Please assist if you are able. How did you get the This indicator on a chart? I am extremely frustrated. I downloaded it from the free community based indicators ast
Price Axis Volume Delta but I am unable to find it anywhere./ I am using the web based application for Tradovate currently.
Sincerely
Fred
May 9 2022
Finally was able to download the Price Axis Volume Delta: I call this chart
The Kitchen Sink: I am an advocate for actual market auction: actual trades that are transacted: it is a bit crowded but, we shall see:
The following chart uses the Price Axis Volume Delta (that I finally found and installed) along in a One minute MNQ
with
This setup helps to instantly l you see the Spikes from the bottom so you can simply track upwards to confirm whether the spike is with or against the ADX Directional, and the Cumulative Delta, and the Delta Histogram, and the Candle Structure)
It is for the very quick take scalper intraday - mostly
Best wishes to all
Hello, Everyone–I think the picture above is the 'Sethmo Better Delta Flow. If so how do I learn about this indicator?
Fart Burger
Hey Ryan–Where can I get information on how to use a chart like this.
Which one? There are two in that image. But if you mean a bid/ask volume horizontal delta footprint there is plenty of info out there about what data is being displayed as this type of chart has existed for many years
