No Bookmap … No problem
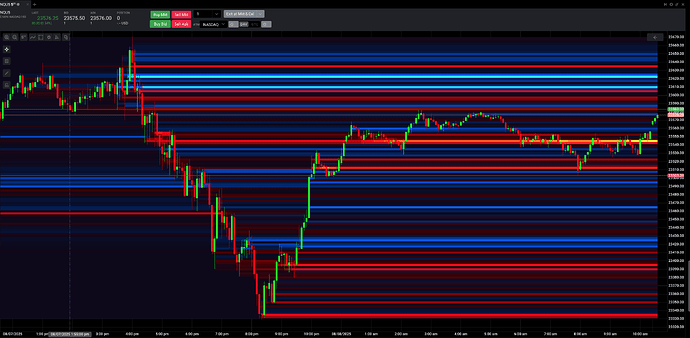
Being a bit jealous of bookmap feature I decided to create a heatmap functionality displaying the cumulative delta over time/bar to get a nice indication of the levels. Because the heatmap does not allow alpha color values or allow drawing order from the base graph (fix this tradovate?) , the best usage is to use also a indicator to draw the candles(See attachment, can only embed 1 media).
You need to have access to profiles data from tradovate accessible under A/heatmap
Hope you find use for it
Color Scheme Interpretation for the Heatmap Plotter
The colors on the heatmap provide an intuitive, at-a-glance view of the underlying order flow dynamics. They represent the cumulative delta, which is the net difference between aggressive buying and aggressive selling volume at specific price levels over a defined lookback period.
The Blue-to-Cyan Gradient (Positive Delta / Buying Pressure)
This color spectrum signifies price levels where buying volume has overwhelmed selling volume. These zones often act as support because they represent areas where buyers have previously shown significant strength and are likely to defend their positions.
-
Dark Blue
- Meaning: Represents a low-to-moderate level of positive cumulative delta.
- Interpretation: These are areas where buyers have shown interest, but not with overwhelming force. They mark the beginning of potential support zones. In the image, you can see many faint blue lines indicating minor levels of buyer activity.
-
Bright Blue
- Meaning: Indicates a stronger, more significant level of net buying pressure.
- Interpretation: These are established areas of support where a considerable amount of buying has occurred.
-
Bright Cyan (Light Blue)
- Meaning: Represents the highest intensity of buying pressure.
- Interpretation: The prominent cyan line near the top of the chart (
~23610) is a critical level. It’s a footprint left by exceptionally aggressive buyers who have absorbed a massive amount of selling. This line represents a powerful institutional support zone.
The Red-to-Yellow Gradient (Negative Delta / Selling Pressure)
This color spectrum signifies price levels where selling volume has dominated buying volume. These zones often act as resistance because they represent areas where sellers have previously been in firm control.
-
Dark Red/Maroon
- Meaning: Represents a low-to-moderate level of negative cumulative delta.
- Interpretation: These are areas where sellers have been active, marking the beginning of potential resistance.
-
Bright Red
- Meaning: Indicates a significant level of net selling pressure.
- Interpretation: These are strong resistance zones. As seen throughout the chart, price often struggles to break through these bright red bands, which are packed with sell orders.
-
Yellow/Orange
- Meaning: Represents the most extreme level of selling pressure.
- Interpretation: The bright yellow/orange line (
~23540) is a zone of maximum seller aggression. It’s a critical resistance level where sellers have historically dumped a huge volume of contracts, halting price advances.
Dark Background (Neutral / No Significant Delta)
- Meaning: The dark, near-black background color (
#0d081b) fills the space where there is no significant cumulative delta. - Interpretation: These are “neutral” price levels where, over the lookback period, neither buyers nor sellers have left a significant footprint. The market has treated these areas as transitional, with no clear control established by either side.
Indicator Parameter Usage: Heatmap Plotter
This document explains the user-configurable parameters for the HeatmapPlotter indicator. These settings allow you to customize the calculation and appearance of the cumulative delta heatmap to fit your trading style and analysis needs.
lookbackPeriod
- Description: This parameter determines the number of historical price bars to include in the cumulative delta calculation. The heatmap will show the net buying and selling pressure accumulated over this specified period.
- Usage:
- A shorter period (e.g., 50) will create a more responsive, short-term heatmap that highlights recent order flow dynamics.
- A longer period (e.g., 200) will create a smoother, longer-term heatmap that shows major historical support and resistance zones built over many bars.
- Default Value:
100
bucketSize
- Description: This controls the vertical granularity of the heatmap by grouping price levels into “buckets.” The indicator calculates the cumulative delta for each bucket rather than for every single tick price.
- Usage:
- A smaller value (closer to the instrument’s tick size) provides a highly detailed, granular view of the order flow.
- A larger value (e.g., 2.0) aggregates the order flow into thicker bands, providing a smoother, less noisy picture of significant price zones.
- Default Value:
1.0
opacity
- Description: This parameter controls the transparency of the colored heatmap lines drawn on the chart.
- Usage:
- Set to
100%for fully opaque, vibrant colors. - Set to a lower value (e.g.,
70%) to make the heatmap more transparent, allowing you to see the underlying candles and chart elements more clearly.
- Set to
- Default Value:
85%
colorThreshold
- Description: This acts as a noise filter. A price level will only be colored if its cumulative delta is greater than this percentage of the maximum cumulative delta found within the
lookbackPeriod. - Usage:
- A low value (e.g.,
1%) will show almost all price levels with any delta activity. - A higher value (e.g.,
10%) will filter out insignificant delta zones, helping you focus only on the most critical levels of buying or selling pressure.
- A low value (e.g.,
- Default Value:
5%
normalization
- Description: This setting determines the mathematical formula used to map the raw cumulative delta values to color intensity. This affects how you perceive variations in order flow.
- Usage:
Square Root(Default): Provides a balanced view. It dampens the visual impact of extremely high delta values, allowing you to still see meaningful variations at lower delta levels.Linear: Creates a direct relationship where a delta twice as large is twice as bright. This method can cause extreme outliers to visually wash out all other levels.Logarithmic: Heavily compresses the high end of the delta range. This is most useful for seeing subtle changes in low-delta areas when massive delta spikes are present elsewhere in the lookback window.
- Default Value:
Square Root
backgroundColor
- Description: Sets the background color for the heatmap area. For a seamless look, this should be set to the same color code as your chart’s background.
- Usage: Enter the hexadecimal color code for your desired background (e.g.,
#000000for black). - Default Value:
#0d081b(a dark blue/purple)


